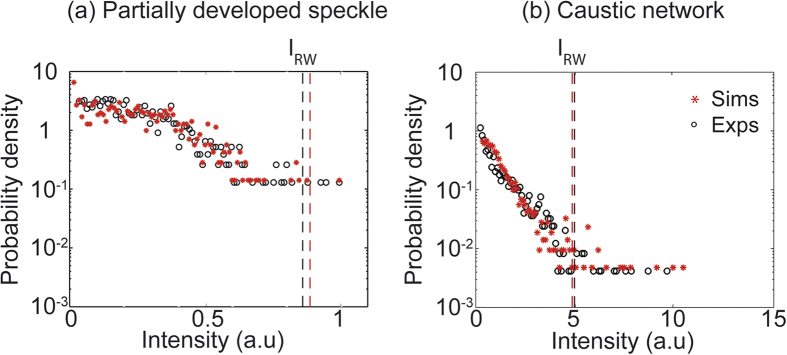
Figure 4. Computed probability distributions from peak height analysis of the intensity patterns shown in Figs 2 and 3.

Results are shown both for (a) partially-developed speckle and (b) a caustic network. The red asterisks and red dashed line correspond to numerical results, the black circles and black dashed line correspond to experimental results. The label IRW indicates the rogue wave intensity criterion.
