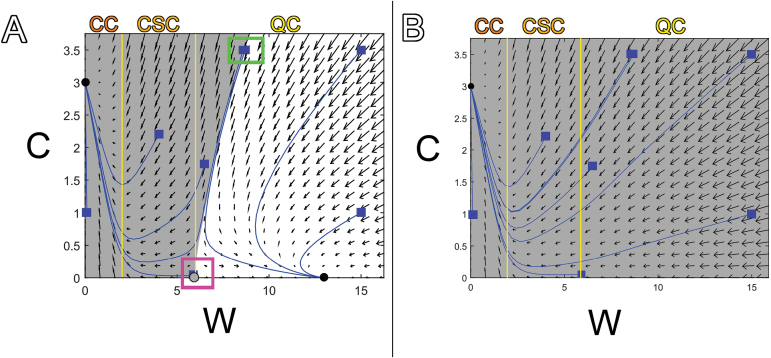
Fig. 4.
Vector diagram of single-cell model results. (A) Fixed points are represented by black and grey filled circles, stable and unstable respectively. Solutions (blue lines) over time were obtained from various initial values (blue squares). Initial values chosen close to the unstable fixed point (like the initial value in the pink box) yield solutions that flow away from that fixed point. The basin of attraction for the CC fixed point at coordinates (0, 3) is shown in grey, and the basin of attraction for the QC fixed point close to (13, 0) is shown in white. Two initial values close to one another but lying in separate basins of attraction (green box) lead to different solutions over time. Vertical yellow lines mark changes in cell fate (where W=Wa and W=Wb). (B) A different set of parameter values (identical to the values used to produce Fig. 1A, but with decreased maximum production rate of W) yields only one fixed point (black dot), which is stable. All values of W and C are within its basin of attraction (grey).

