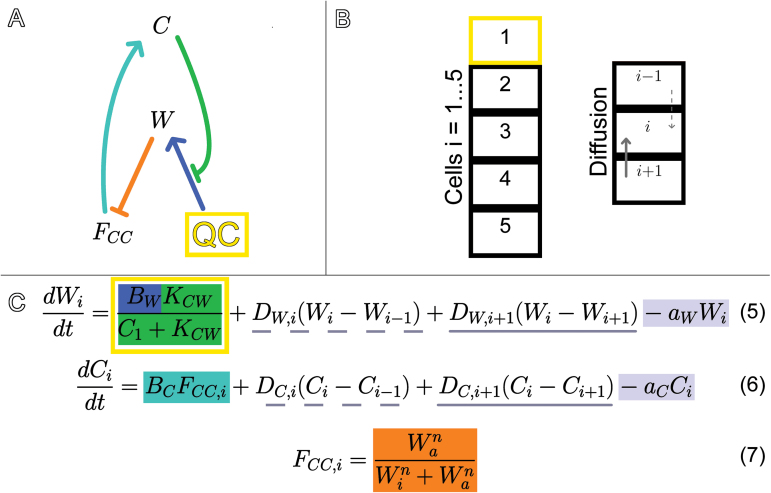
Fig. 5.
Graphical and mathematical representations of the C/W multi-cell model of cell fate. (A) C represses W (green), which represses FCC (orange). FCC promotes C (teal). W production is confined to the QC cell (yellow). (B) The model simulates a cell column. The cell with index i=1 is the QC (yellow cell), while the model determines the fates of those distal to it. W and C can both diffuse through the cell column and the value of each in cell i are denoted Wi and Ci. (C) Equations 5, 6, and 7. The W production term in the yellow box only applies in the QC cell and W production is restricted by the amount of C signalling to the QC (green). Diffusion terms track the fluxes of W and C between cell i and its proximal neighbour (dotted underline) and between cell i and its distal neighbour (solid underline). A diffusion term is omitted if an index is outside of 1 through 5; there is no flow between the QC and the cell proximal to it and no flow between the 5th cell and the cell distal to it. The value of FCC in cell i (FCC,i, orange) determines the fate of cell i and the production rate of C (teal) in cell i. W and C are degraded at constant rates (grey).

