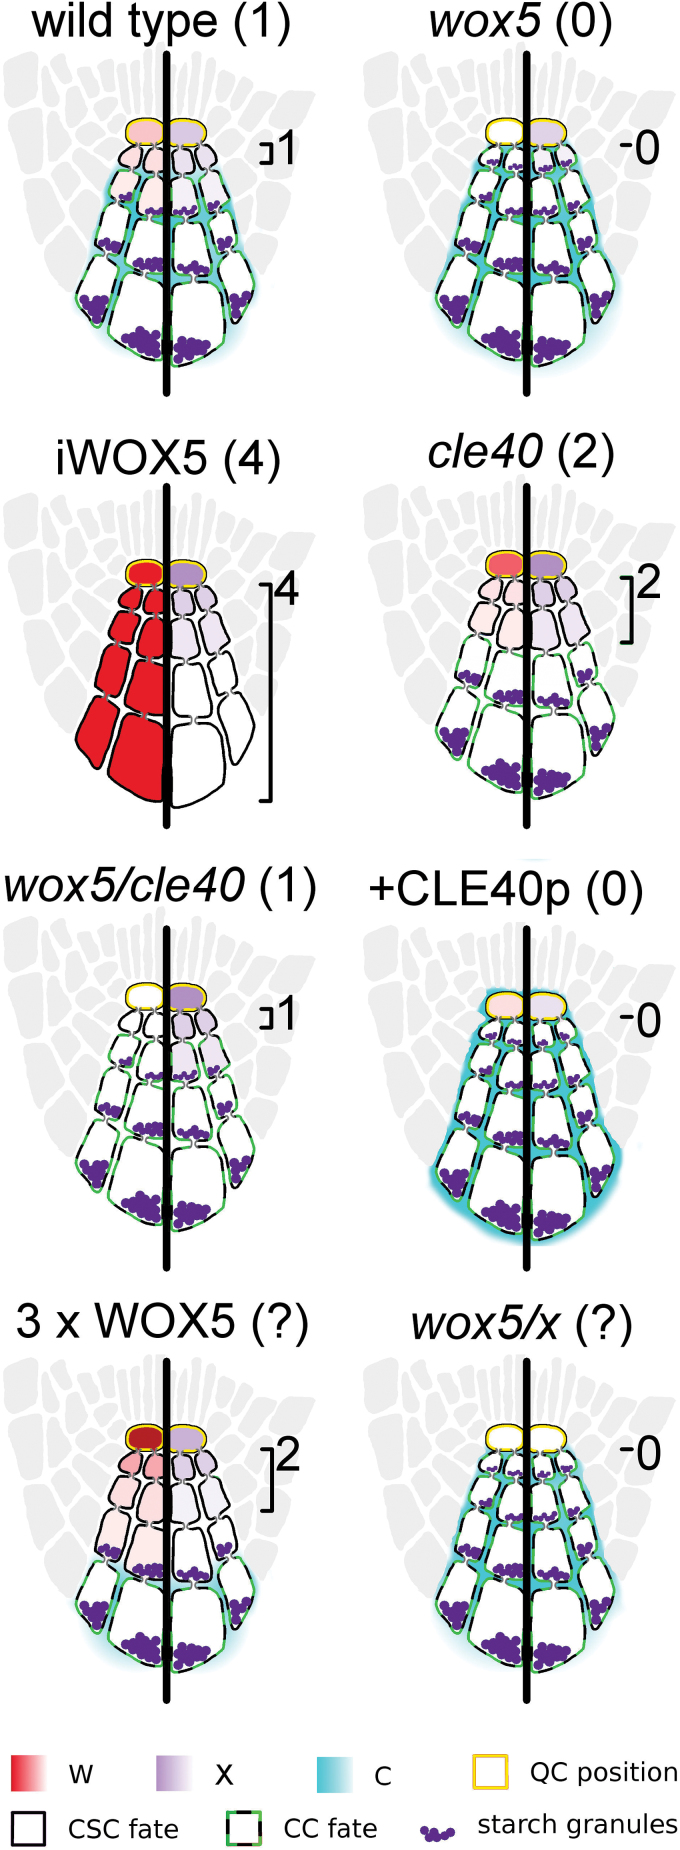
Fig. 9.
Representation of C/W/X multi-cell model predictions of CSC fate and C/W/X localization. Gradients of W as predicted by the model are shown on the left sides of roots, while X gradients are shown on the right. Expected number of CSC rows, based on experimental results, is shown in parentheses, while those based on model predictions are shown next to the root diagram. The model outcomes can emulate the expected number of rows for wild type, wox5 mutants, cle40 mutants, wox5/cle40 double mutants, constitutively expressed WOX5 (iWOX5), and the addition of sufficient amounts of CLE40p (+CLE40p). We have also used the model to predict results of experiments that have not yet been completed to aid in later validations of this model. Tripling the W production rate (3× WOX5) is expected to yield more layers of stem cells. In the case of these parameter values, it is expected to result in two layers.

