Fig. 6.
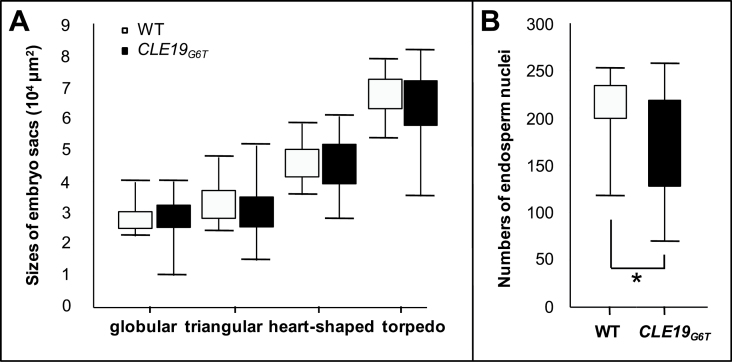
Delayed embryo sac and endosperm development in pCLE19:CLE19 G6T :tCLE19 transgenic plants. (A) Smaller sizes of embryo sacs in pCLE19:CLE19 G6T :tCLE19 transgenic plants (CLE19 G6T) as compared with those in the wild type (WT). Box plots are used to show total embryo sac areas. The whole area occupied by the embryo and endosperm was measured. Upper and lower bars represent the largest and the smallest sizes of embryo sacs, respectively. Note that smaller embryo sac sizes were observed in transgenic plants at all four stages (globular, triangular, heart-shape, and torpedo) examined (n=30). (B) Lower numbers of endosperm nuclei in pCLE19:CLE19 G6T :tCLE19 transgenic plants (CLE19 G6T) compared with the wild type (WT) when counted at the triangular stage of embryo development (n=30). Significantly reduced endosperm nuclei numbers (P<0.05 by Welch’s t-test) were observed in transgenic plants (indicated by asterisks).

