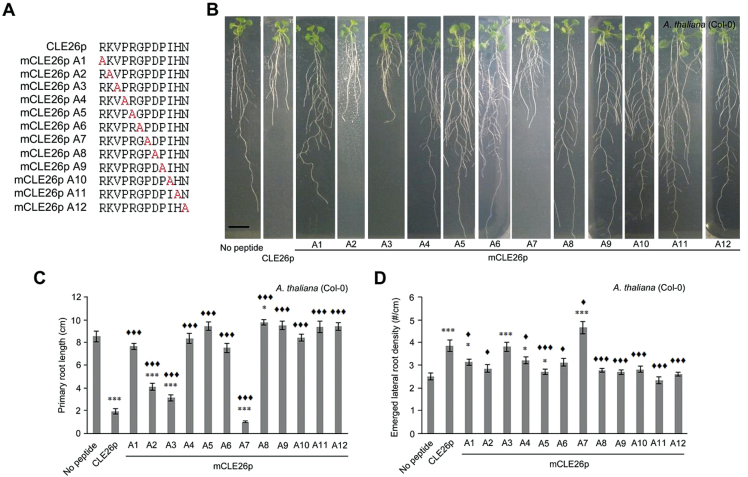
Fig. 4.
CLE26p alanine scanning on A. thaliana. (A) Sequence of synthetic CLE peptides used. (B) Representative pictures of mCLE26p-treated wild-type seedlings at 12 d after germination. (C, D) Quantification of primary root length (C) and emerged lateral root density (D) for mCLE26p-treated wild-type seedlings. The bar graphs indicate the mean ±SE. Statistical significance (Student’s t-test) compared with no peptide (*) and to CLEp treatment (♦) is indicated: ***/♦♦♦P<0.001, */♦P<0.05. Scale bar=1cm. (This figure is available in colour at JXB online.)

