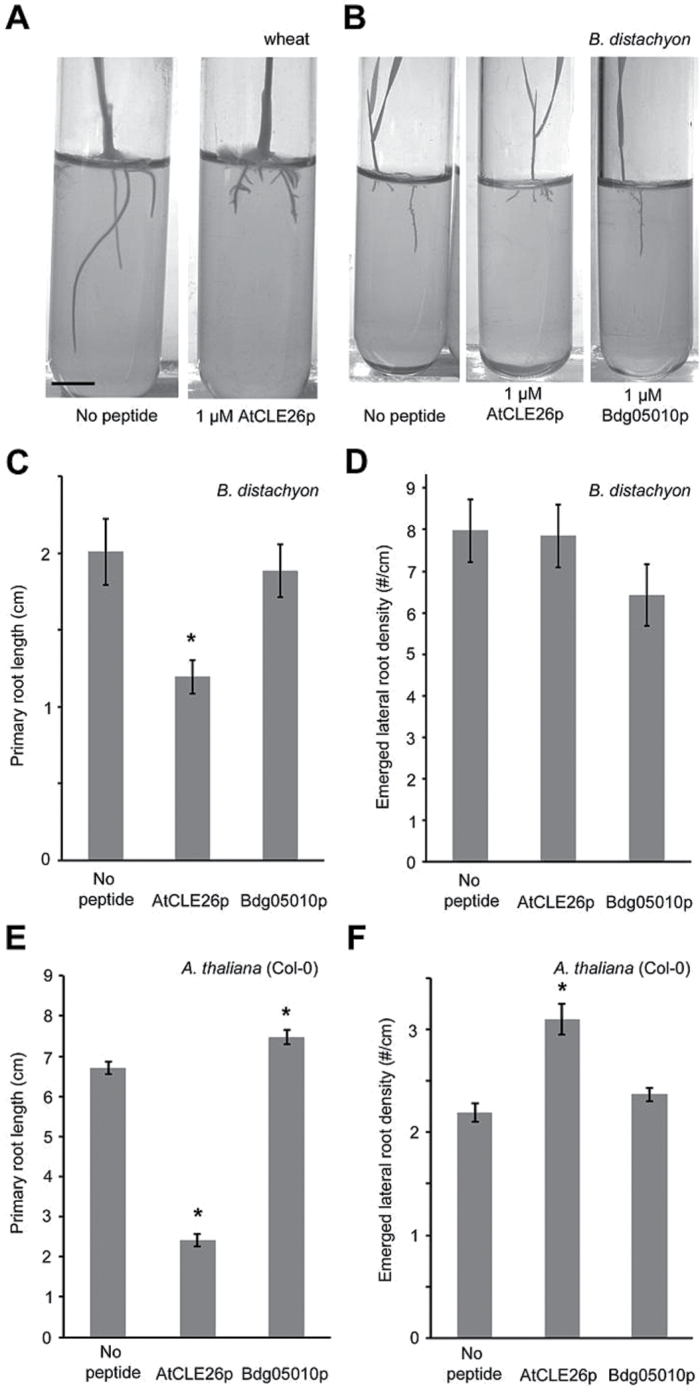
Fig. 6.
Effect of AtCLE26p and BdCLE26p on wheat, B. distachyon, and A. thaliana. (A, B) Representative pictures are shown for wheat (A) and B. distachyon (B) at 12 d after germination. (C, D) Quantification of B. distachyon seedling primary root length (C) and emerged lateral root density (D). (E, F) Quantification of A. thaliana seedling primary root length (C) and emerged lateral root density (D). The bar graphs indicate the mean ±SE. Statistical significance (Student’s t-test) compared with no peptide treatment is indicated: ***P<0.01. Scale bar=1cm.

