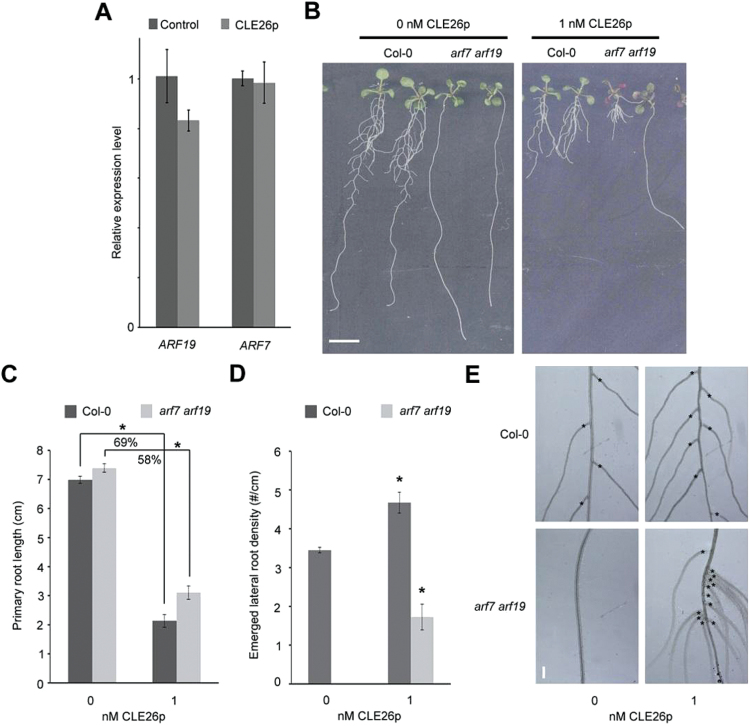
Fig. 9.
CLE26p and ARF7−ARF19. (A) ARF7 and ARF19 expression as determined by qPCR in 7-day-old seedling roots treated with 1 μM CLE26p for 24h. The bar graph indicates the mean ±SE. (B–E) Root phenotype of CLE26p-treated Col-0 and arf7arf19 at 9 d after germination. Representative pictures (B) and quantification of primary root length (C) and emerged lateral root density (D). The bar graphs indicate the mean ±SE. Statistical significance (Student’s t-test) compared with no peptide treatment: *P<0.05. Scale bar=1cm (B) and 100 μm (E). (E) Detail of lateral root positions (asterisk) and density in Col-0 and arf7arf19 following peptide treatment. (This figure is available in colour at JXB online.)

