
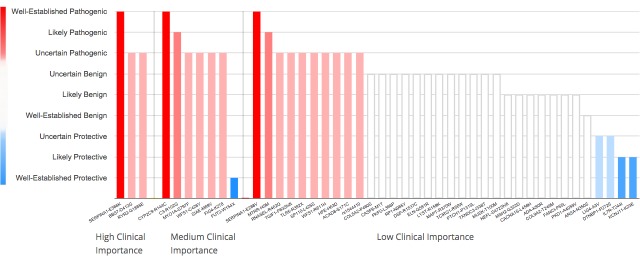
Figure 4.
Bar chart: bars represent gene variants. A bar’s height and color represent the potential effect of the variant. Variants are separated by clinical importance. Information about a variant appears upon hovering over a bar.
Official websites use .gov
A
.gov website belongs to an official
government organization in the United States.
Secure .gov websites use HTTPS
A lock (
) or https:// means you've safely
connected to the .gov website. Share sensitive
information only on official, secure websites.
Bar chart: bars represent gene variants. A bar’s height and color represent the potential effect of the variant. Variants are separated by clinical importance. Information about a variant appears upon hovering over a bar.