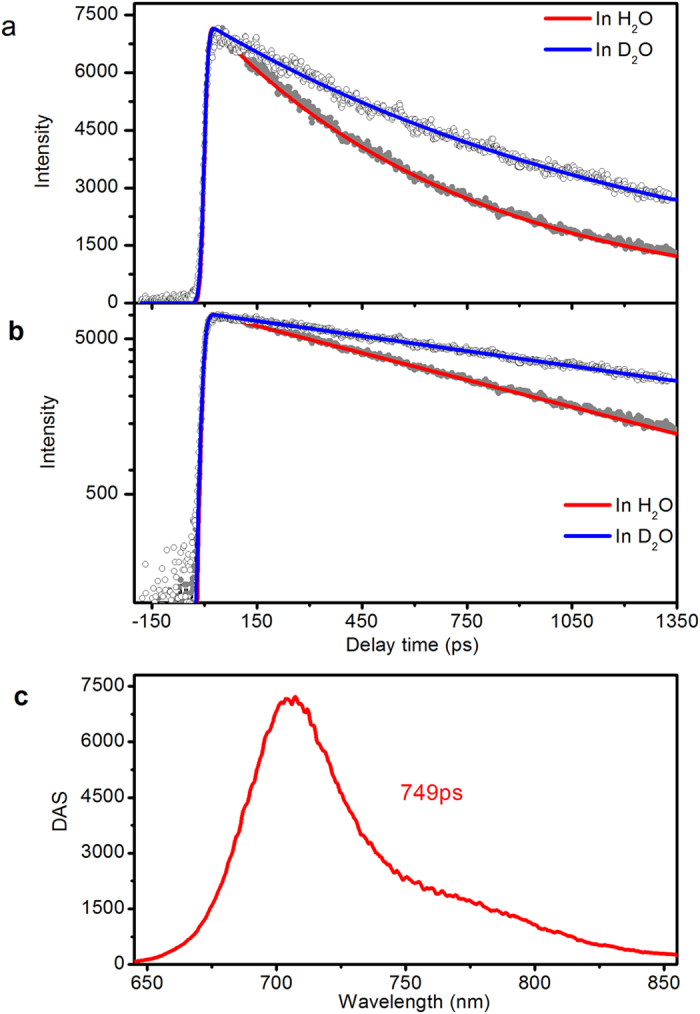
Figure 2. Time resolved fluorescence of iRFP702.

(a) Decay of fluorescence at 702 nm in H2O and D2O with global fitted curves. (b) The same decay curves as in Fig. 2a but in logarithmic scale intensity. (c) DAS extracted by global fitting with a single exponential function. Data for iRFP713 and iRFP720 are shown in Fig. S3 and Fig. S2, respectively.
