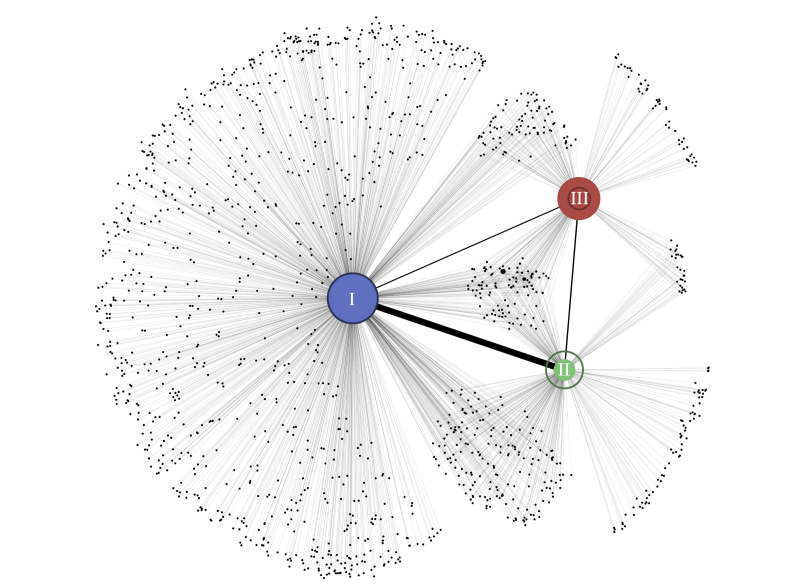
Figure 1.
Visualization of connectivity between 1420 communities identified at maximum modularity (Q). Each circle represents a community with filled circle diameter indicating the relative number of within-module edges. Lines joining pairs of communities are drawn with a thickness that is proportional to the number of edges connecting them. The largest 3 communities (community I, II, and III) are labeled and filled in color. Darker rings superimposed on communities I, II, and III are proportional in diameter to the number of nodes making up each.

