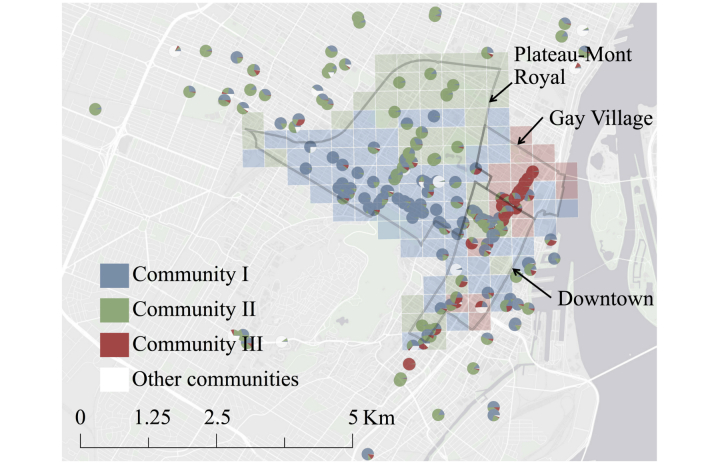
Figure 2.
Map of hotspot locations with points on map represented by pie charts indicating the relative contributions of each community to the total visits recorded at that hotspot. Community III was primarily concentrated in the Gay Village neighborhood of the Ville-Marie borough of Montreal, whereas communities I and II primarily occupied the high-traffic commercial areas on either side of the Plateau-Mont-Royal neighborhood; all 3 communities coincided downtown. Each grid square is colored to represent the locally dominant community. Squares with no hotspots are colored to represent the dominant community at the nearest hotspot.

