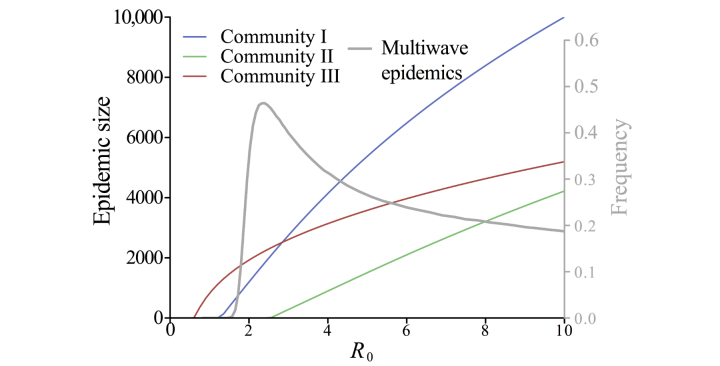
Figure 3.
Expected within-community epidemic size assuming that communities were approximately random networks and maintained their empirical within-community degree distributions (colored lines; primary y-axis). The epidemic threshold for each community (ie, R0 value for which transmission is sustained) is lowest for community III, followed by communities I and II. The frequency of multiwave epidemics depended on R0 and is highest when R0=2.4 (gray line; secondary y-axis).

