
Figure 5.
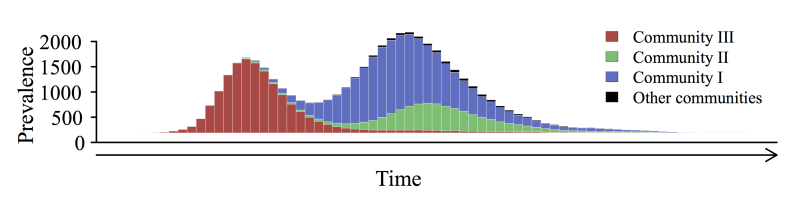
A typical epidemic curve with 2 waves (R0=3.7). Community III drove the first wave; communities I and II drove the second wave.
Official websites use .gov
A
.gov website belongs to an official
government organization in the United States.
Secure .gov websites use HTTPS
A lock (
) or https:// means you've safely
connected to the .gov website. Share sensitive
information only on official, secure websites.
A typical epidemic curve with 2 waves (R0=3.7). Community III drove the first wave; communities I and II drove the second wave.