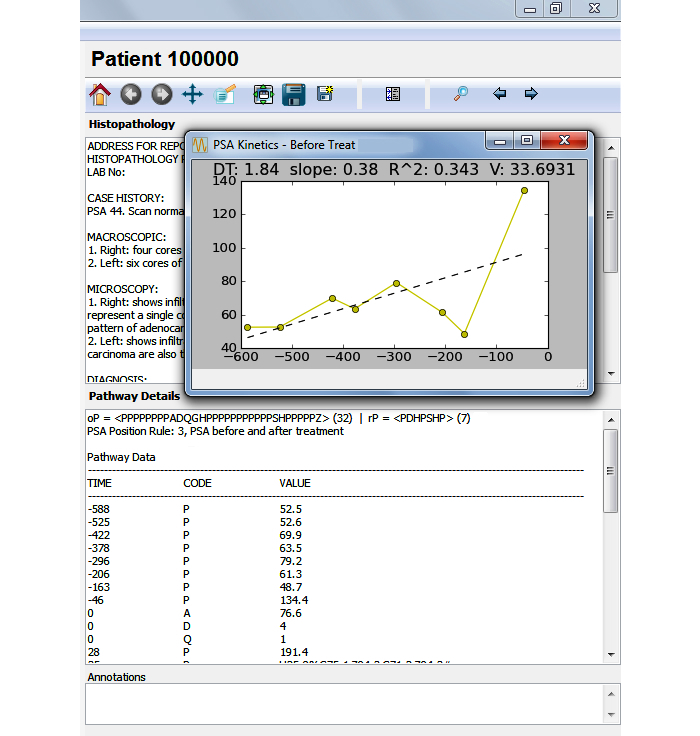
Figure 5.

The carcinoma of the prostate visualization and interpretation system (CaP VIS) system showing the right side of the screen where additional information about the patient pathway is seen. There are three sections that show the histopathology report, the pathway details in the format presented in this paper, the annotations section, and a fourth section (hidden) contains pathway statistics. An overlapping window shows in detail the prostate specific antigen (PSA) kinetics before treatment, computed for this pathway. The toolbar above the histopathology section allows the user to zoom and pan the plotted pathway (in Figure 4), as well as to save the plotted figure to file, search for particular patient pathway, or navigate to the previous or next patient pathway. Doubling time (DT) and velocity (V).
