
Figure 2.
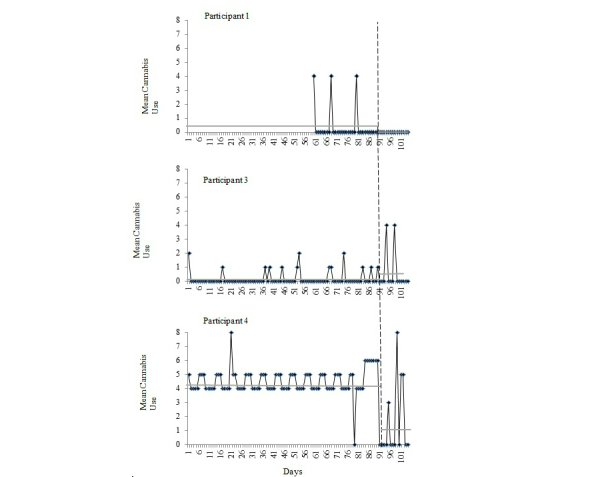
Quantity of cannabis use during each day of the 90-day (30-days for participant 1) baseline and 2-week follow-up periods for each participant, as measured by the MSHQ (Participant 1) and TLFB (Participants 2-4). Vertical dashed line indicates the cessation day for each participant. Because Participant 2 did not complete the follow-up assessment, his data are not presented. Horizontal gray solid lines represent mean cannabis use during the represented timeframe (baseline, 2-week follow-up).