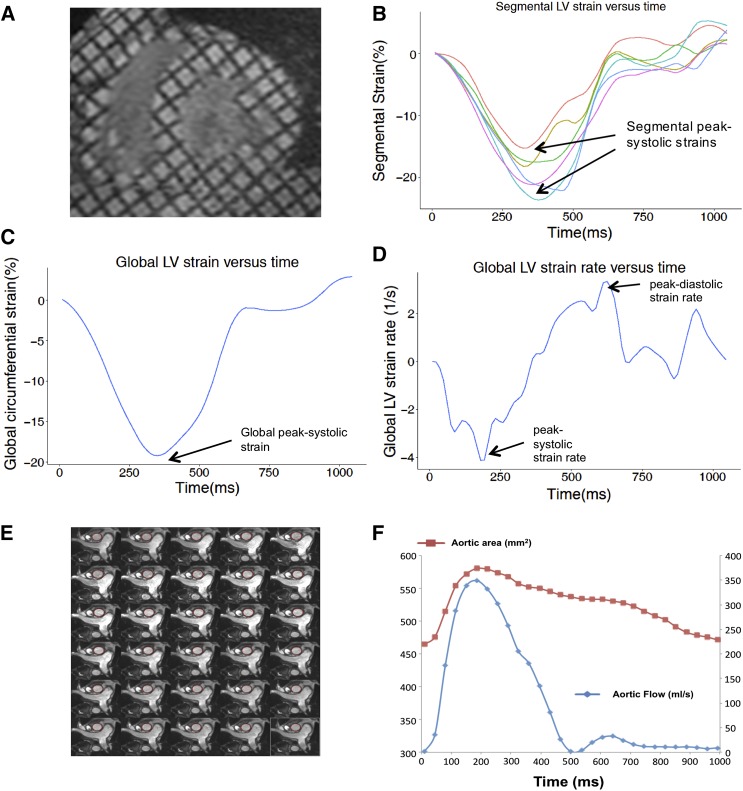
Figure 1.
Cardiac magnetic resonance imaging analysis in a typical study participant. Tagged LV short-axis images (A) and derived LV segmental strain curves (B). These were averaged to determine the global LV strain (C) and strain-rate (D) curves from which peak systolic and diastolic values were used as study outcomes (arrows). Aortic distensibility was determined by semiautomated tracing of the ascending aorta in 30 phases per cardiac cycle (E) to derive the aortic area (F, red line, left y axis) and aortic blood flow (F, blue line, right y axis). LV, left ventricular.

