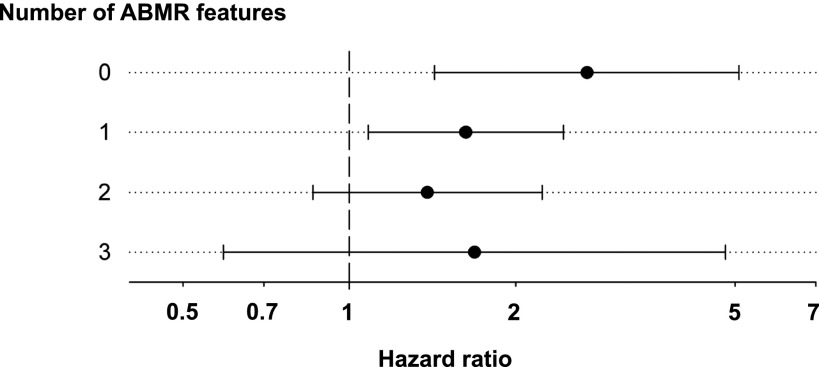
Figure 2.
Forest plot of the risk of graft failure in relation to biopsy findings. Hazard ratios (95% confidence intervals) are shown for C4d (score ≥1) in relation to the discrete number of antibody-mediated rejection features. Confounding variables included in the model (recipient age, donor age, HLA-mismatch, cold ischemia time) were selected according to the purposeful selection algorithm as described in the Materials and Methods section.

