
Fig. 4.
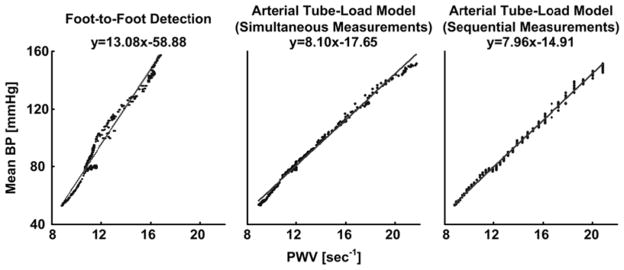
Sample plots of mean BP versus PWV estimates from simultaneously and sequentially measured central and peripheral BP waveforms from Dog 3. A value of unity was used here and elsewhere for the length component of the PWV estimates, as it has no impact on the correlation between BP and PWV within a subject. Line and equation indicates line of best fit. (Note that the PWV estimates are clustered for the sequential measurements due to waveform sampling and that this clustering is masked for the simultaneous measurements due to averaging the PWV estimates.)