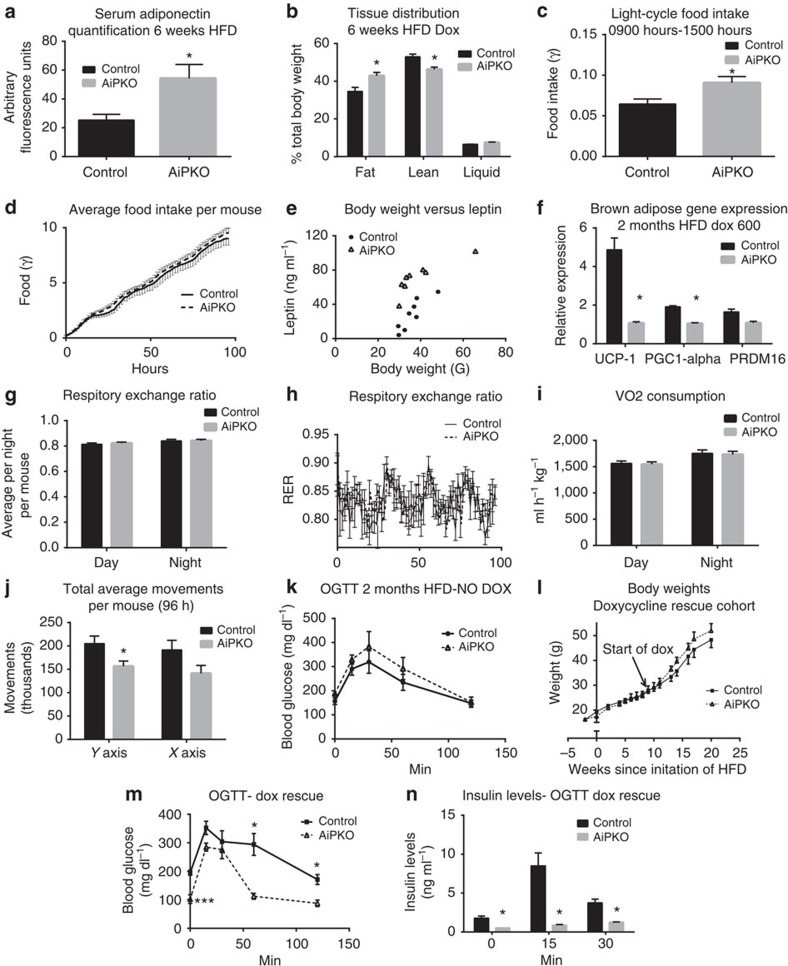
Figure 3. Metabolic characterization after inducible loss of PTEN in adipocytes.
(a) Serum adiponectin levels of mice fed HFD doxycycline diet for 6 weeks, quantified using a Licor western blot scanner (N=6 control and 4 AiPKO). Full blot in Supplementary Fig. 1. (b) Tissue distribution determined by a Bruker MQ10 NMR analyzer and expressed as percent of total body weight (N=5 in both groups). (c) Average food intake per mouse per hour during peak light cycle (sleep cycle, 0900–1500 hours) in a metabolic cage analysis (N=4 control and 6 AiPKO). (d) Average total food intake per mouse over the 4 days of metabolic cage analysis (N=4 control and 6 AiPKOs). (e) Circulating leptin levels versus body weight after 6 weeks of HFD containing doxycycline (600 mg kg−1) in the AiPKO and control mice as measured by ELISA (Millipore EZML-82K) (N=8 for each group). (f) Gene expression in brown adipose tissue following 6 weeks of doxycycline (600 mg kg−1) containing diet (N=3 control and 2 AiPKO). (g) Respiratory exchange ratios (RERs) for day and night cycles averaged per 12-h period per mouse (N=4 control and 6 AiPKOs). (h) Average respiratory exchange ratios for each group taken every 1.5 h over the 4 days of metabolic cage analysis (N=4 control and 6 AiPKOs). (i) Volume of consumed oxygen for day and night periods, averaged per mouse, per hour, per kilogram (N=4 control and 6 AiPKOs). (j) Average total movements per mouse during metabolic cage analysis (96 h) (N=4 control and 6 AiPKOs). (k) Concentration of glucose in blood during OGTT (2.5 g kg−1) after 8 weeks of HFD feeding without doxycycline (average AUC; control: 27,725, AiPKO: 32,702, Student's test on AUC P-value=0.4246). (l) Average body weights of mice in a cohort fed 8 weeks on HFD, followed by 8 more weeks of HFD containing doxycycline (600 mg kg−1) (N=7 control and 3 AiPKO). (m) Concentration of glucose in blood of mice from (l) during OGTT (2.5 g kg−1) after 8 weeks of HFD feeding without doxycycline followed by 4 weeks of HFD feeding containing doxycycline (600 mg kg−1) (average AUC; control: 32,087, AiPKO: 18,951; P-value=0.0279). (n) Serum insulin concentrations of mice during an oral glucose tolerance test, as shown in (m). *P<0.05, **P<0.01. All data are shown as mean±s.e.m.

