
Fig. 10.
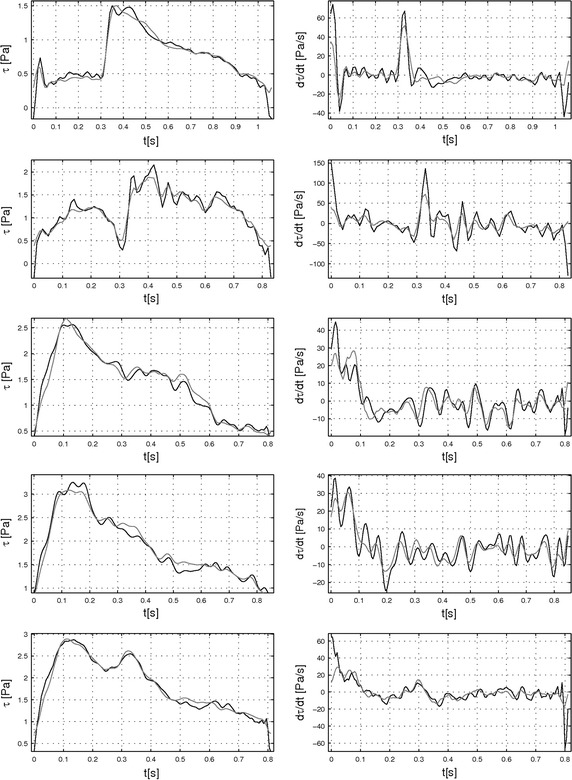
Comparison between wall shear stress and wall shear stress time derivative calculated by the Womersley’s solution in in vivo blood vessels and in the in vitro test bench. Hemodynamic properties, such as the wall shear stress (left panel) and wall shear stress time derivative (right panel) were calculated from Womersley simulations of in vivo data (solid black lines) and from reproduction by our in vitro test bench (solid grey lines) and plotted against time. Rows from top to bottom refer to patients from 1 to 5. All graphs are drawn for one period cycle.