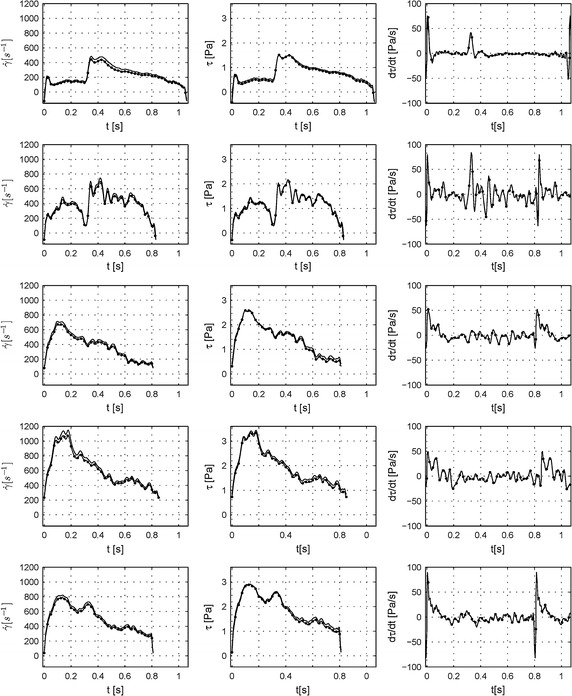
Fig. 8.

Comparison between Womersley’s solution and non-Newtonian 2D axisymmetric CFD simulations: wall shear rate, wall shear stress and wall shear stress time derivative. Vascular endothelial cells respond is strongly connected to the hemodynamic properties such as wall shear rate (1st column), wall shear stress (2nd column) and wall shear stress time derivative (3rd column)—solid lines CFD simulations, solid lines with bullets Womersley’s solution. Rows from up to down present patients from 1 to 5. All graphs are drawn for one period cycle.
