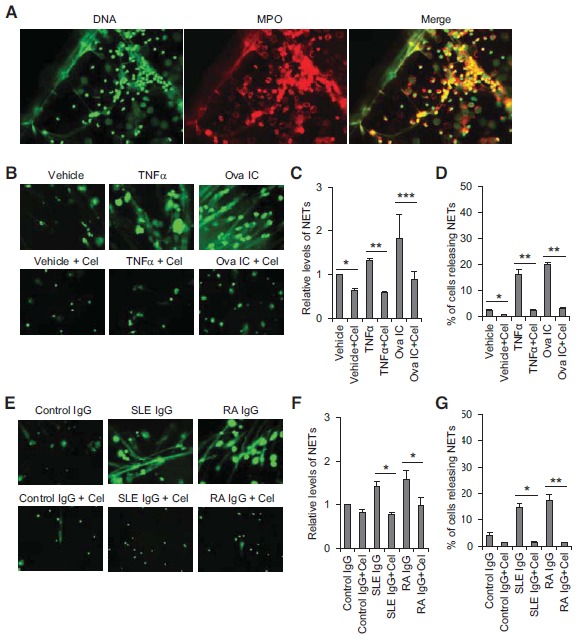
Fig. (3).

Celastrol inhibits NET formation. A, Representative pictures showing co-localization of NET DNA (stained with DAPI) with myeloperoxidase (stained with myeloperoxidase-specific antibody) by immunofluorescence analysis. B and E, Representative pictures of fluorescence microscopy showing that celastrol (10 µM) inhibited NET formation induced by TNFα and Ova IC (B) or total IgG purified from SLE or RA patient sera (E). Decondensed fiber-like chromatin DNA released in NETs was stained by non-cell permeable nucleic acid dye SYTOX Green. The small round stained dots represent dead cells. C, D, F and G, A summary showing celastrol significantly inhibits NET formation induced by TNFα and Ova IC (C and D) or total IgG purified from SLE or RA patient sera (F and G). In C and F, the relative levels of NET formation were presented by fold changes of SYTOX Green fluorescence intensity compared to vehicle or control IgG-stimulated neutrophils quantified by a fluorescence polarization microplate reader. In D and G, the released NETs were visualized by fluorescence microscopy, and the percentage of neutrophils releasing NETs was calculated as the average of six fields (X20) normalized to the total number of cells. The data was plotted as the mean ± SD and represented at least three independent experiments. *p < 0.05, **p<0.01, and ***p< 0.001 by ratio paired t-test (C and F) or paired t-test (D and G). Cel: celastrol.
