
Fig. (4).
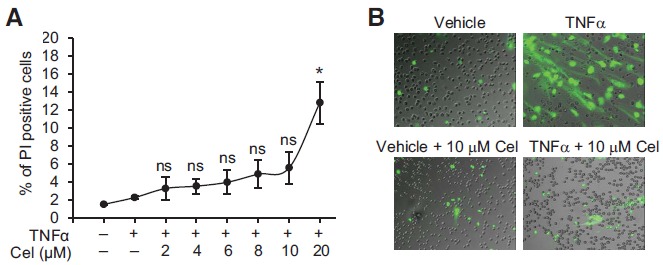
Cytotoxicity test of celastrol. A, A diagram showing percentages of dead neutrophils (PI+) when treated with different doses of celastrol during TNFα-induced oxidative burst. Data were plotted as the mean ± SD and represented at least three independent experiments. B, Representative pictures of fluorescence microscopy showing cytotoxicity of celastrol (10 µM) on neutrophils during TNFα-induced NET formation. Chromatin DNA in NETs or dead cells was stained by non-cell permeable nucleic acid dye SYTOX Green. The graphs shown were fluorescence images merged with differential interference contrast (DIC) images. NS: not significant (p > 0.05 by paired T test); * p < 0.05 by paired T test; Cel: celastrol.