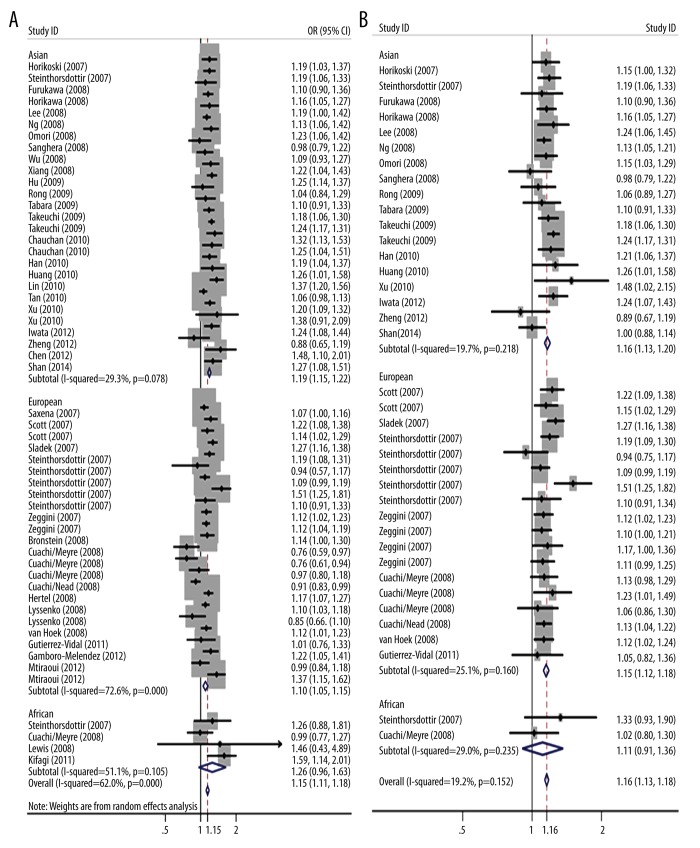
Figure 2.
Stratified analysis based on ethnicity for the association between SLC30A8 polymorphism rs13266634 and type 2 diabetes risk under allelic model. (A) Using individual adjusted ORs from all original articles, (B) using individual calculated ORs from studies with detailed genotype distribution. Each study is shown by the point estimate of the odds ratio, and a horizontal line denotes the 95% confidence interval. The pooled odds ratio is represented by a diamond. The area of the grey squares reflects the weight of the study in the meta-analysis.

