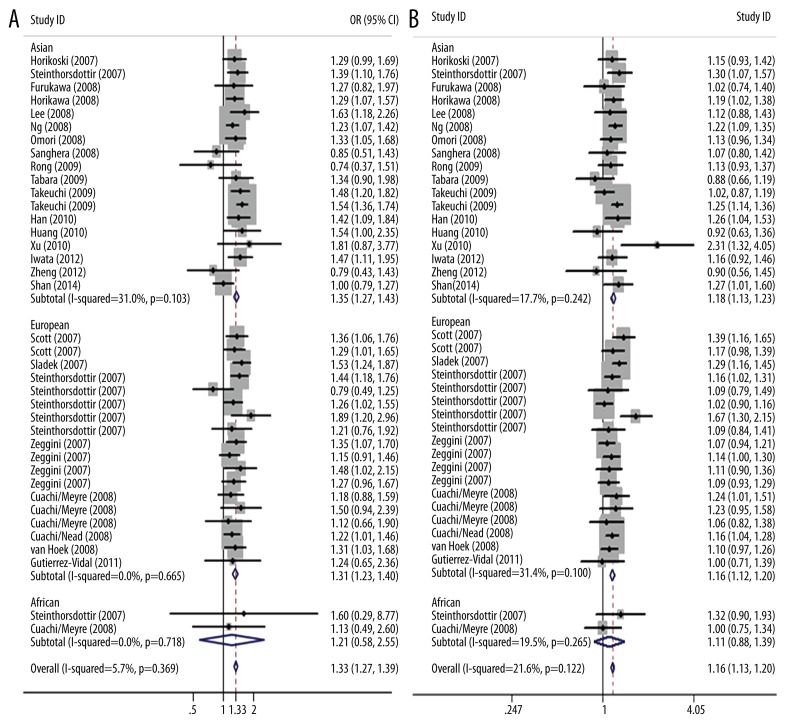
Figure 3.
Stratified analysis based on ethnicity for the association between SLC30A8 polymorphism rs13266634 and type 2 diabetes risk under codominant genetic model. (A) CC vs. TT, (B) CC vs. CT. Each study is shown by the point estimate of the odds ratio, and a horizontal line denotes the 95% confidence interval. The pooled odds ratio is represented by a diamond. The area of the grey squares reflects the weight of the study in the meta-analysis.

