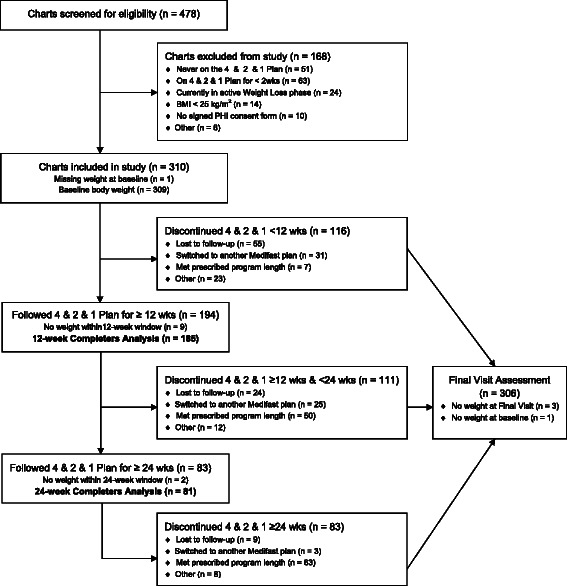
Fig. 1.

Flow diagram. Chart disposition at week 12 (primary endpoint), week 24 and Final Visit. The Completers population included all individuals that had weight data within the specified visit window. Final Visit represents an individual’s last visit to the MWCC while following the 4 & 2 & 1 Plan. The time of the Final Visit varies by individual, depending on when they discontinued the 4 & 2 & 1 Plan
