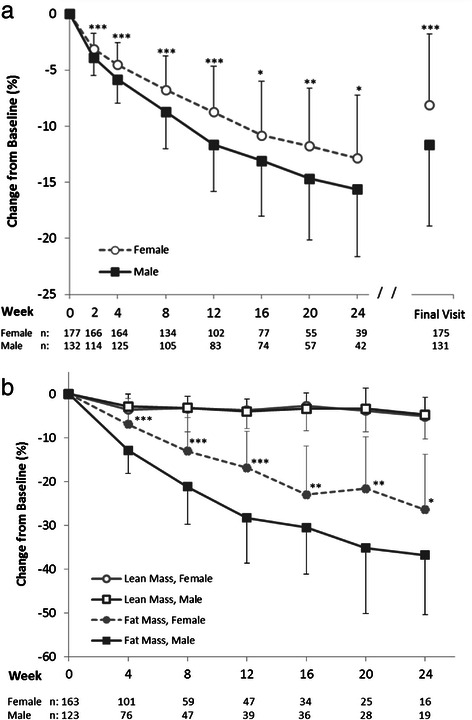
Fig. 5.

Percent change from baseline in (a) body weight and (b) lean and fat mass by gender. Mean (±SD) for the Completers population which included all individuals with weight data at the given visit; sample sizes are designated below the graph. Final Visit represents an individual’s last visit to the MWCC while on the 4 & 2 & 1 Plan. Significance levels for all within group changes from baseline were p < 0.0001 for body weight and fat mass and p < 0.01 lean mass (not shown). Significance levels for between group comparisons using bivariate t-tests at each time point are shown: *p < 0.05; **p < 0.01; ***p < 0.0001
