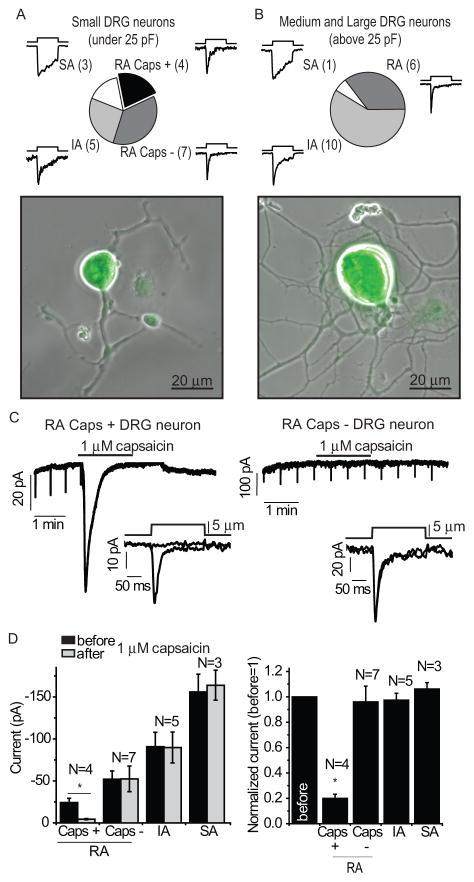
Figure 1.
The effects of capsaicin on whole-cell MA currents in DRG neurons isolated from TRPV1 reporter mice. (A) Pie chart showing the distribution of the rapidly adapting (RA), intermediate adapting (IA), and slowly adapting (SA) MA currents in small YFP-positive neurons. The RA group is subdivided into cells that respond to 1 μM capsaicin with large inward currents (Caps +) and cells that did not (Caps −). The numbers in parenthesis are the number of neurons tested in each group. None of the IA and SA cells responded to capsaicin. (B) Pie chart showing the distribution of the different types of MA currents in medium and large YFP-positive neurons. None of these neurons responded to capsaicin. Bottom panels in A and B show overlay of fluorescent and phase contrast images of a small and large neuron, respectively. (C) A representative traces recorded at −60 mV with mechanical stimulation every 30 seconds in a capsaicin-responsive neuron (left) and a nonresponsive neuron (right); the application of 1 μM capsaicin is indicated by the horizontal bars. The downward spikes correspond to the individual MA current evoked by the repetitive mechanical stimuli. Insets show individual MA currents on enlarged time scales before and after the application of capsaicin; the mechanical step protocol, indicating the displacement of the mechanical probe is also shown. (D) Statistical analysis for small neurons showing the raw data (left) and normalized data (right) of peak MA currents measured before and after capsaicin. * p<0.05, Analysis of Variance (ANOVA)

