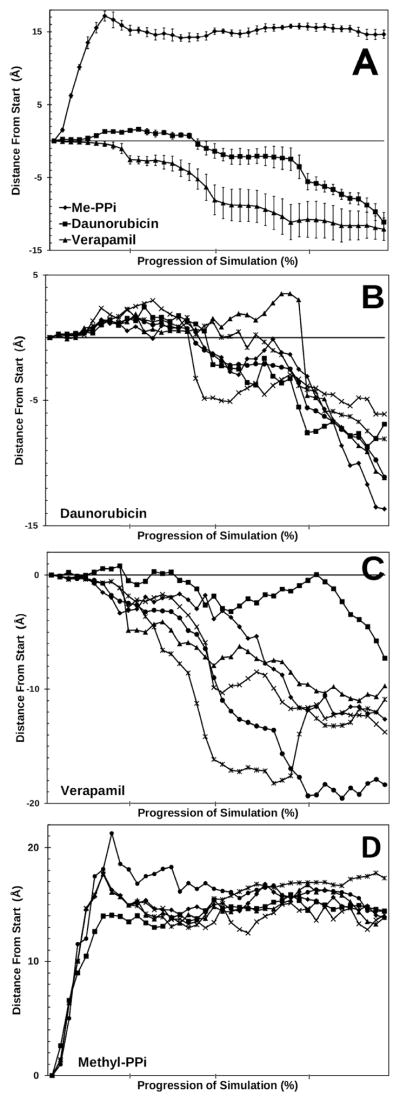
Figure 3. Movement of daunorubicin and verapamil though P-glycoprotein.

Panel A: The center of mass of daunorubicin, verapamil, or methylpyrophosphate was calculated for each step of the simulation relative to the distance from their respective starting locations. The first quarter of the graphs represents unconstrained molecular dynamics before the application of the targeted forces. The remaining data represents the movements between targeted structures achieved by TMD techniques. The structures were oriented with the plane of the membrane in the X and Y direction, so that movement through the membrane is oriented on the Z-axis. Movement towards the extracellular space is represented by negative directions on the Z-axes, while movement towards the cytoplasm is in positive Z-axis directions. Distances are presented in Å and show the movement of the centers of mass of the ligands in the Z-axis. Six simulations were performed for daunorubicin (squares), verapamil (triangles), or methylpyrophosphate (circles) each. Average movement of the centers of mass of each ligand are presented. Error bars represent one standard error of the mean. Movement through the membrane towards the extracellular space is equivalent to movement from positive values to negative values in these plots. Panel B : Same as panel A except that results for the six individual daunorubicin simulations are presented. Panel C: Same as B except that individual results for verapamil are shown. Panel D: Same as B except that individual results for methylpyrophosphate are shown.
