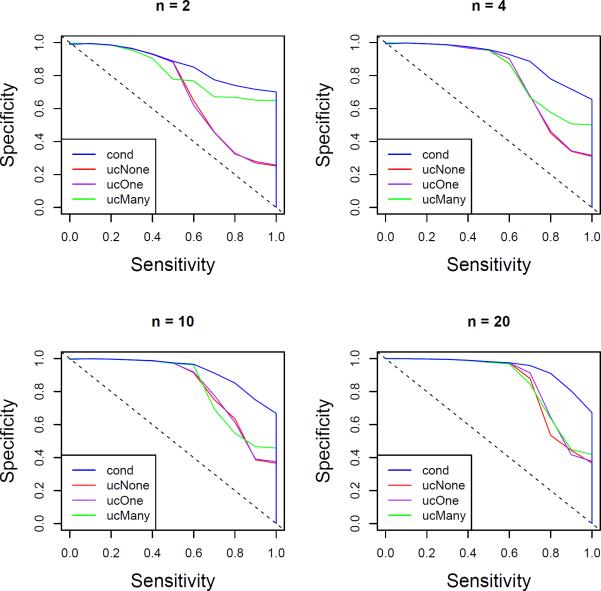
Figure 5.
ROC curves for fixed p. Average ROC curves are plotted for conditional model (blue), unconditional model with no intercept (red), unconditional model with single intercept (purple) and unconditional model with intercept for every stratum (green). p = 100, n ranges over 2 (top left), 4 (top right), 10 (bottom left) and 20 (bottom right). Sample sizes are kept as close to 150 as possible, .

