
Fig. 1.
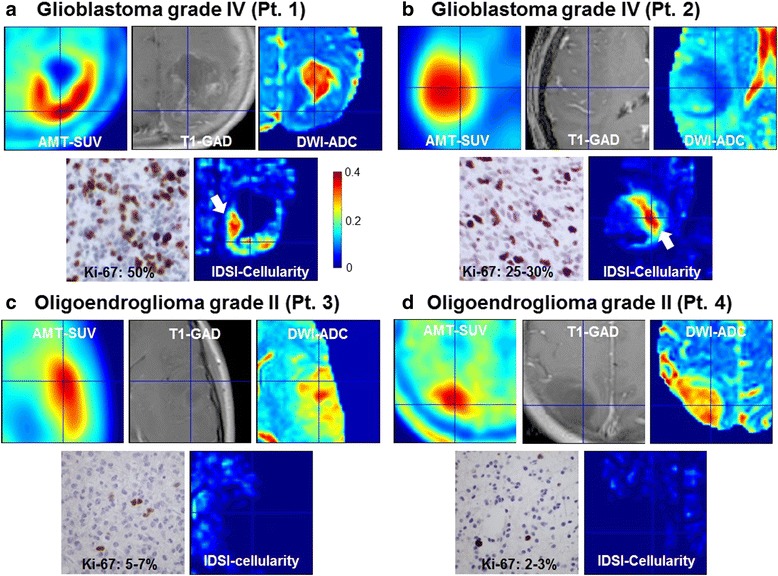
Representative images of AMT-SUV, T1-GAD, DWI-ADC and IDSI-cellularity obtained from two patients with a grade IV glioma (a and b), and two patients with a grade II glioma (c and d). The tumor in Pt. 1 (a) showed contrast enhancement surrounding a necrotic core on MRI. AMT-PET showed high uptake (in red) in the tumor region that surrounded the necrotic core with no AMT uptake; on histopathology, this tumor had dense cellularity and high Ki-67 labeling index in the region showing high AMT uptake (up to 50 % of the nuclei, as illustrated by the immunostaining on the bottom left). The tumor of Pt. 2 (b) showed minimal contrast enhancement on MRI, moderate cellularity and lower Ki-67 labeling index (25-30 % of the nuclei). Increased AMT-SUV showed the extent of the tumor with no necrotic core. White arrows indicate the cluster of voxels showing increased cellularity corresponding to increased AMT-SUV and decreased ADC value. Note that none of the voxels show high cellularity in the region of increased AMT-SUV in patients with a low-grade glioma (Pt. 3 and 4), consistent with low proliferative index and lower cellularity on histopathology, despite moderately high AMT uptake in these tumors