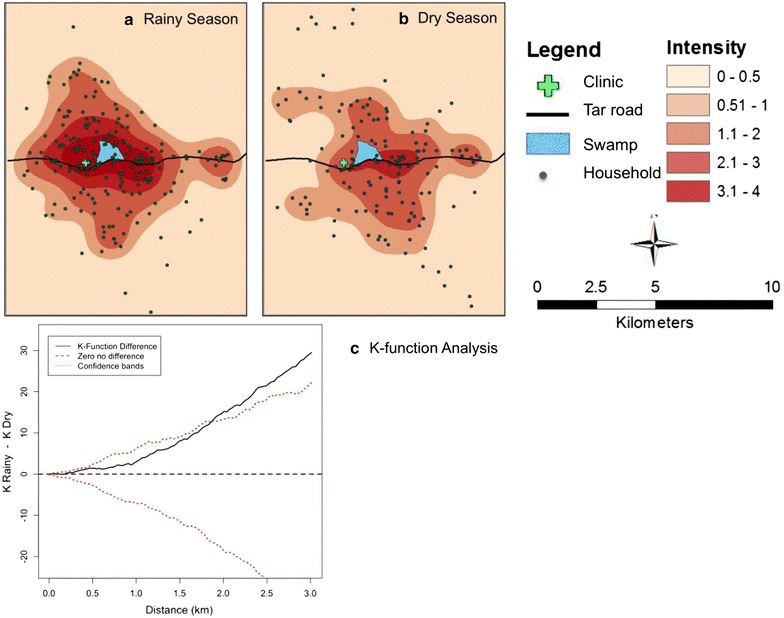
Fig. 2.

Estimated spatial intensity for index households in the rainy season (a) and dry season (b). Also shown is the K function difference comparing spatial clustering in the rainy versus dry season (c). Figure has three panels that display the estimated spatial intensity for index households calculated in the rainy season (a) and dry season (b). The third panel is the K function difference comparing the degree of spatial clustering by season (c).
