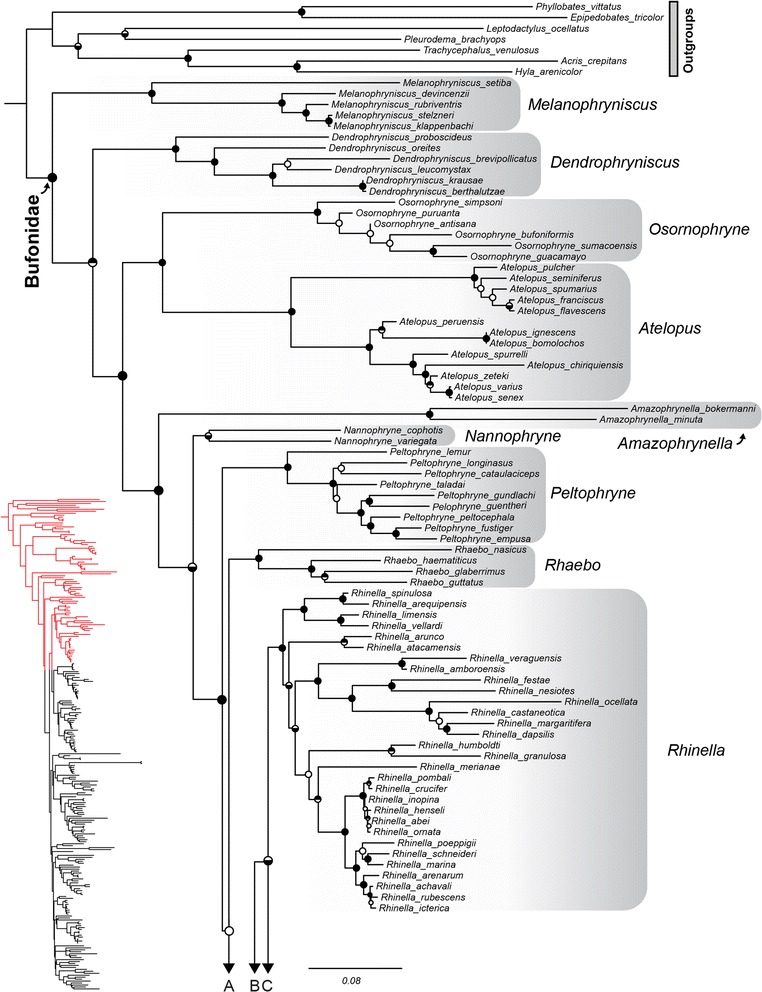
Fig. 2.

Phylogenetic relationships of global bufonids, part one. The maximum likelihood tree of the Bufonidae, based on 13 loci and 243 taxa. Filled circles on nodes represent high support (Bayesian posterior probabilities [BPP] > 0.95 and maximum likelihood bootstrap scores [MLBS] > 70%); circles with top half fill: MLBS > 70% and BPP < 0.95; circles with bottom half fill: MLBS < 70% and BPP > 0.95; open circles represent support values less than given threshold for both analysis types. Branch lengths are proportional to substitutions/site, indicated by scale bar below, and genera are outlined in grey shading. Letters below correspond to connections to Fig 3. The portion of the phylogeny represented is highlighted in red on the full topology.
