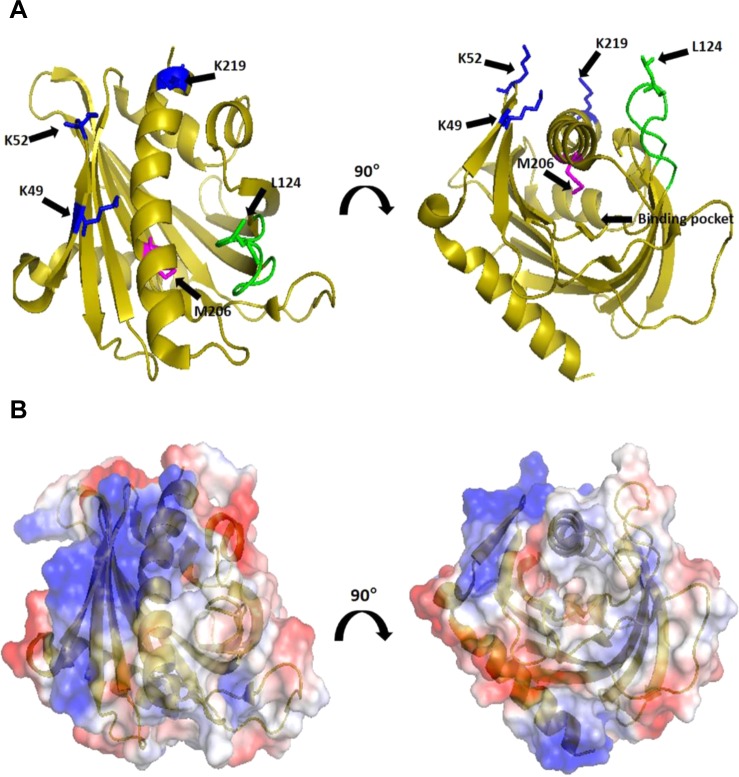
Figure 1.
Regions of STARD4 involved in membrane interactions. (A) Ribbon representation of STARD4 in which positively charged K49/52 and K219 (blue), M206 (magenta), and Omega-1 (Ω1) loop (green) are featured. Individual residues are identified according to the sequence of STARD4. (B) Surface representation of STARD4 colored according to the electrostatic potential.21 Structures are rotated 90° about the z-axis for a view of the sterol binding pocket of STARD4. Structures were created in PyMOL (DeLano Scientific, Palo Alto, CA).

