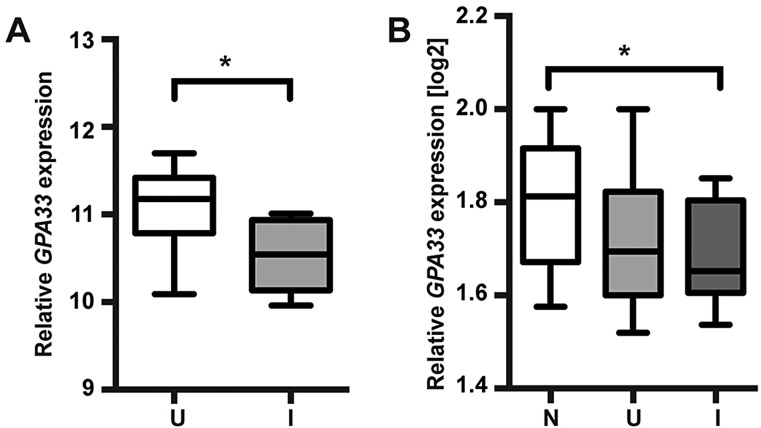
Fig. 7.
GPA33 expression is reduced in the inflamed bowel of individuals with IBD. Relative GPA33 expression in normal (N), uninflamed (U) and inflamed (I) bowel of individuals with IBD represented as whisker and box plots; *P<0.05. (A) GPA33 expression is elevated in inflamed compared to uninflamed bowel from individuals with CD (uninflamed n=18, inflamed n=8; dataset GDS3119) (Olsen et al., 2009). (B) GPA33 expression is elevated in inflamed bowel from individuals with UC compared to normal bowel (normal n=22, uninflamed n=15, inflamed n=19; dataset GDS3268) (Noble et al., 2008). Relative gene expression values were normalised using (A) Human Genome U133 Plus 2.0 Array Normalisation Controls (Affymetrix) and (B) Stratagene Universal Human Reference (Stratagene).

