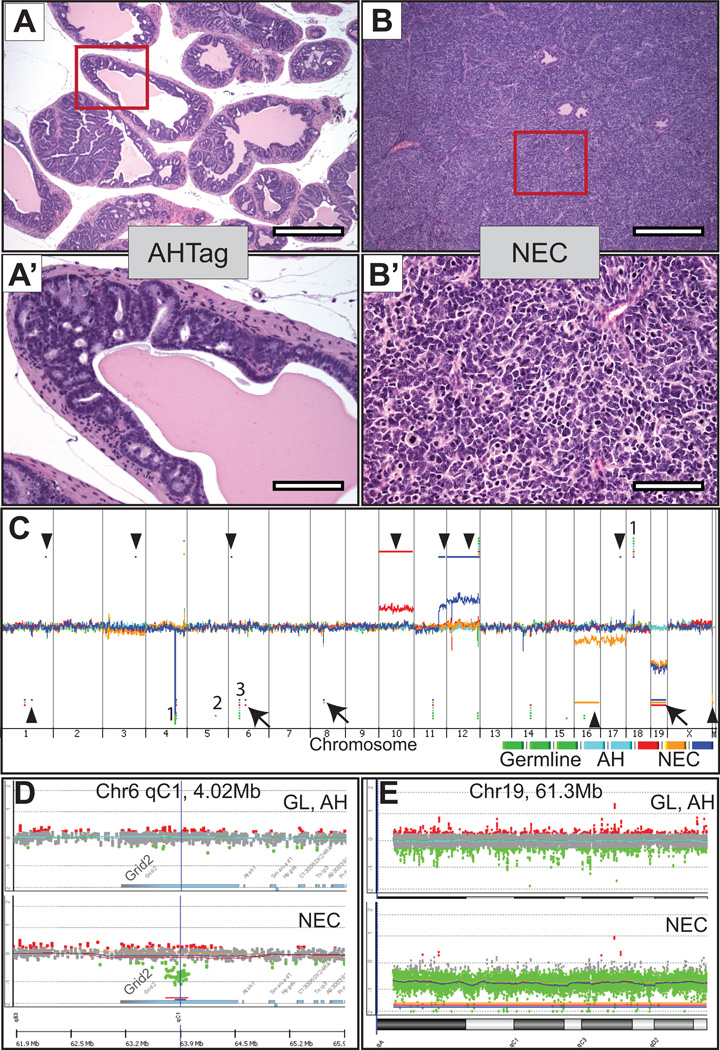
Figure 1. Histology and genomic copy number alterations in TRAMP tumors.
A–B’ Representative microscopic images from hematoxylin and eosin-stained TRAMP sections from the prostate glands from which DNA was extracted for CGH analysis. A-A’, TRAMP atypical hyperplasia of Tag (AHTag) at low (4×) and high-power (20×) respectively. B-B’, TRAMP neuroendocrine carcinoma (NEC) at low (4×) and high-power (20×) respectively. C, Copy number alterations (CNAs) in TRAMP mice by array CGH. Genomic DNA from C57BL/6. FVB TRAMP prostate NE carcinomas, AHTag lesions and spleen germline DNA control were hybridized against sex-matched normal mouse C57BL/6 reference DNA using Agilent CGH slides containing 180K probes. Whole genome view of overlaid moving averages (2 Mb window) for the log2 ratios of fluorescence between a sample/reference DNA probe (Y axis) plotted at its genomic position (X axis), red, blue and yellow (NE tumors; n = 3), cyan blue shades (AHTag n = 2) and green shades (germline n = 3). Aberrations called in any samples (germline and tumor) by the ADM-2 algorithm are identified by a horizontal bar (red, blue and yellow: NE tumors), Cyan (AHTag) and Green (germline DNA). Aberrations present in at least two (out of 3) NE tumors are indicated by arrows; those found in individual mice are indicated by arrowheads. (1) Representative CNVs in common between germline, AHTag and NE tumors; (2) Aberrations called by the ADM-2 algorithm in a single sample that by manual inspection exhibited similar fluorescence intensities in all samples including germline and tumor (see Supplemental Figure S2, for representative examples); (3) Example of a known strain-specific alteration in the FVB strain (a copy number loss in the t-cell receptor V-beta gene segment (chr6:41,018,389–41,112,757). D, Zoom-in view of chromosome 6 showing overlaid data points for log2 ratios of the Grid2 gene region. Green: values below log2 = −0.25; Red: values above log2 = 0.25. Upper panel spleen and AHTag samples. Lower panel NE tumors showing a SCNAs in the Grid 2 gene. Aberrations called by the ADM-2 algorithm are identified by a horizontal line (bottom). E, Zoom-in on whole chromosome 19 showing overlaid data points for log2 ratios. Green: values below log2 = −0.25; Red: values above log2 = 0.25. Upper panel spleen and AHTag samples. Lower panel NE tumors showing a copy number loss of whole chr19. The aberration called by the ADM-2 algorithm of the entire chromosome 19 is identified by a horizontal line (bottom).

