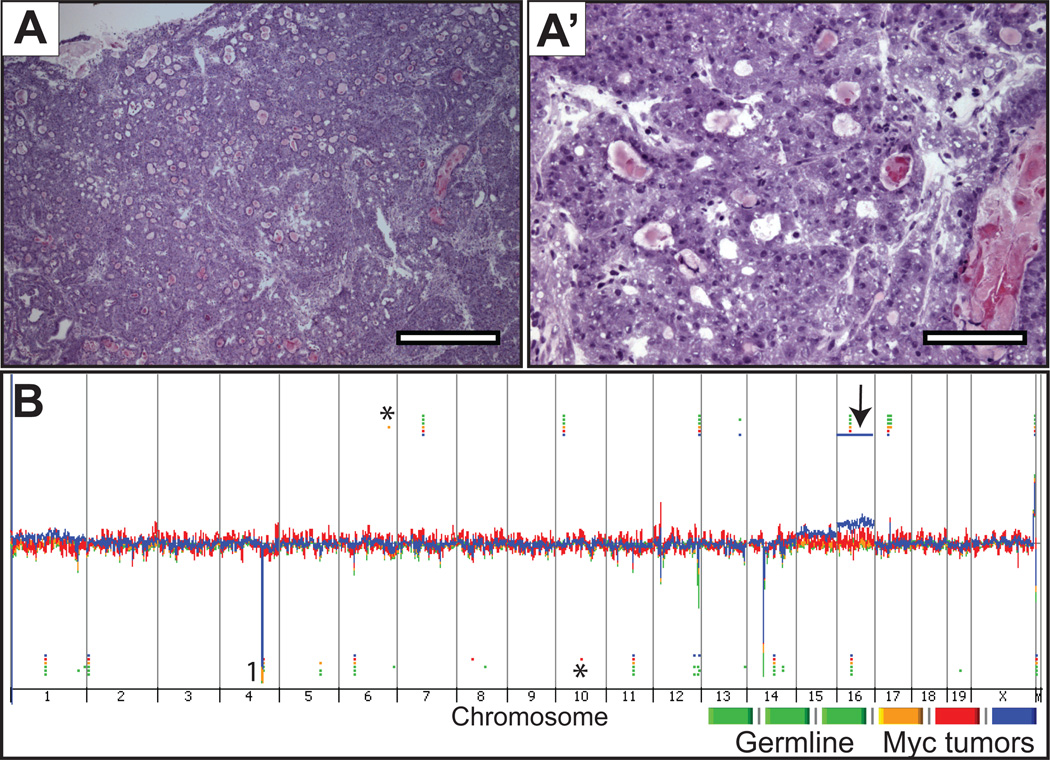
Figure 3. Histology and genome view of c-Myc prostate tumors.
A-A’, representative microscopic images from hematoxylin and eosin-stained sections from frozen prostate tissue where the DNA was extracted for CGH hybridization, at low (4×) and high-power (20×) magnification, respectively. B, Genomic DNA from c-Myc prostate tumors and spleen were hybridized against sex-matched normal mouse C57BL/6 reference DNA using Agilent CGH slides containing 180K probes. Whole genome view of overlaid moving averages (2 Mb window) for the log2 ratios of fluorescence between a sample (germline and c-Myc tumor DNA) and reference (sex-matched normal mouse C57BL/6) DNA probe (Y axis) plotted at its genomic position (X axis). Red, blue and yellow (tumors; n = 3) and green shades (germline n = 3). Aberrations called by the ADM-2 algorithm are identified by horizontal bars. (*) Aberrations called by the ADM-2 algorithm in single samples, that by manual inspection show similar fluorescence intensities in all samples including germline and tumor (see supplemental Figure S5, for representative examples); (1) CNAs in common between germline and Hi-Myc tumors that are not visually obvious in the genome view window.

