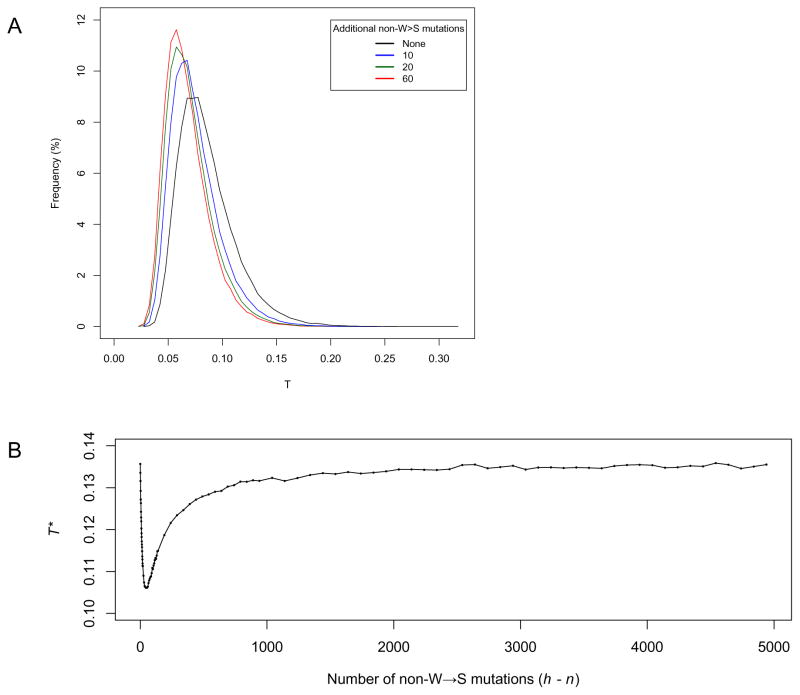
Figure 2.
The influence of non-W→S substitutions on the T statistic and its critical values. A) Examples of T distributions for N = 5000, n = 60, and G adjusted for the presence of additional non-W→S human-specific substitutions (h − n): 0 (black), 10 (blue), 20 (green), 60 (red). B) Variation of the critical T* value (defined as the 95th percentile of the T distribution) relative to the number of non-W→S mutations, when N = 5000, n = 60.

