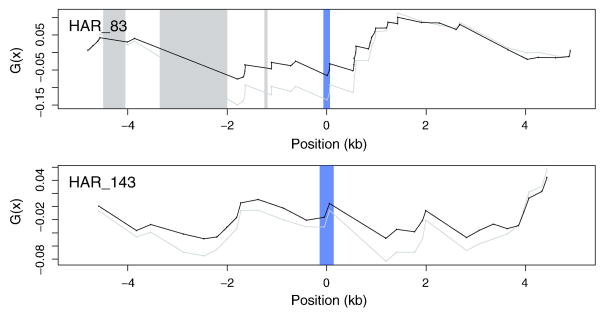
Figure 6.
The Ga function (black line) for genomic regions surrounding HAR83 and HAR143, which are both assigned to the Cb+ class, but do not overlap significant hotspots of W→S mutations. Blue bars correspond to HARs, while grey regions correspond to alignment gaps longer than 50 bps. The original G function is represented by a grey line.

