Figure 2.

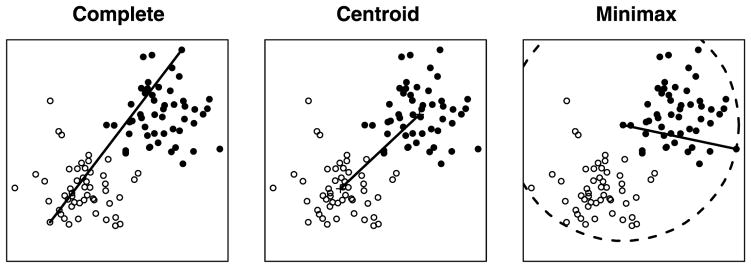
Complete, centroid, and minimax linkages. The solid black line represents the distance between the two clusters according to each linkage. The circle is of radius r(G ∪ H), where G and H denote the two clusters.

Complete, centroid, and minimax linkages. The solid black line represents the distance between the two clusters according to each linkage. The circle is of radius r(G ∪ H), where G and H denote the two clusters.