
Figure 4.
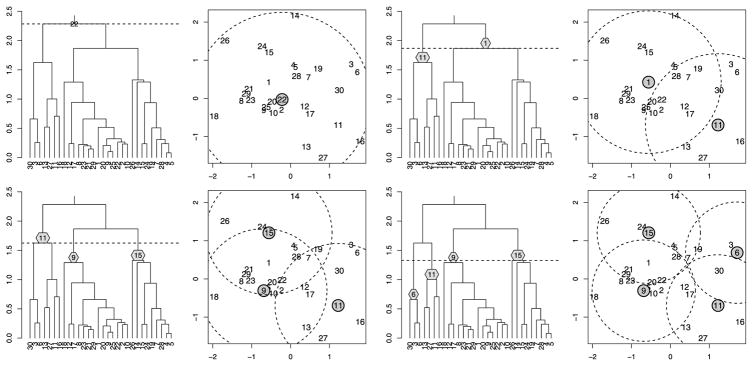
Successive cuts of a dendrogram with prototypes displayed: Cutting at height h yields a set of prototypes (shown in gray) such that every element of the dataset is covered by the set of balls of radius h centered at the prototypes. As h decreases, more prototypes are required.