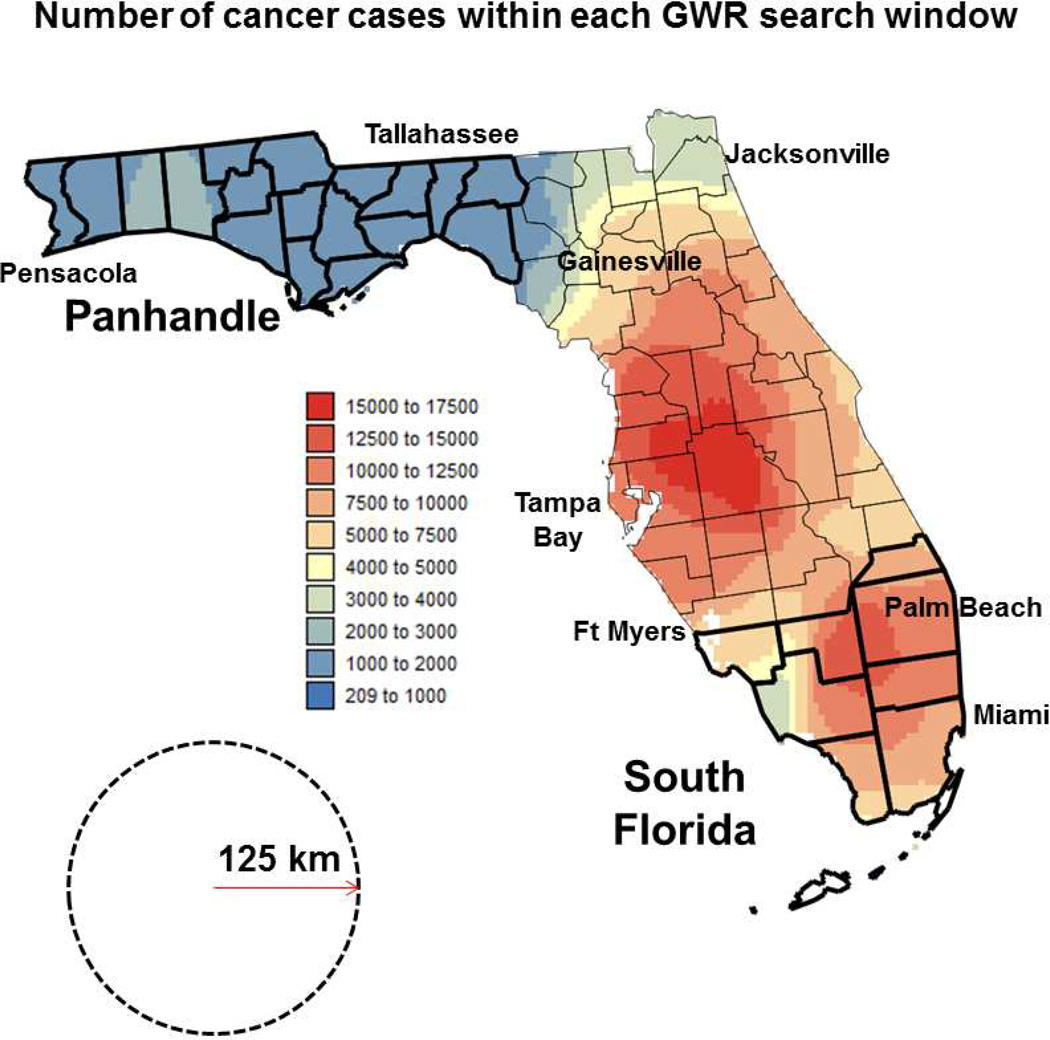
Fig. 1.
Map of the number of prostate cancer cases used for each of the GWR models. This isopleth map is overlaid with Florida county map and labels indicating main regions and cities cited in the discussion section. The black dashed circle represents the window of radius 125 km used for geographically-weighted regression. Counties demarcated by thick boundary lines are part of the Panhandle and South Florida regions.

