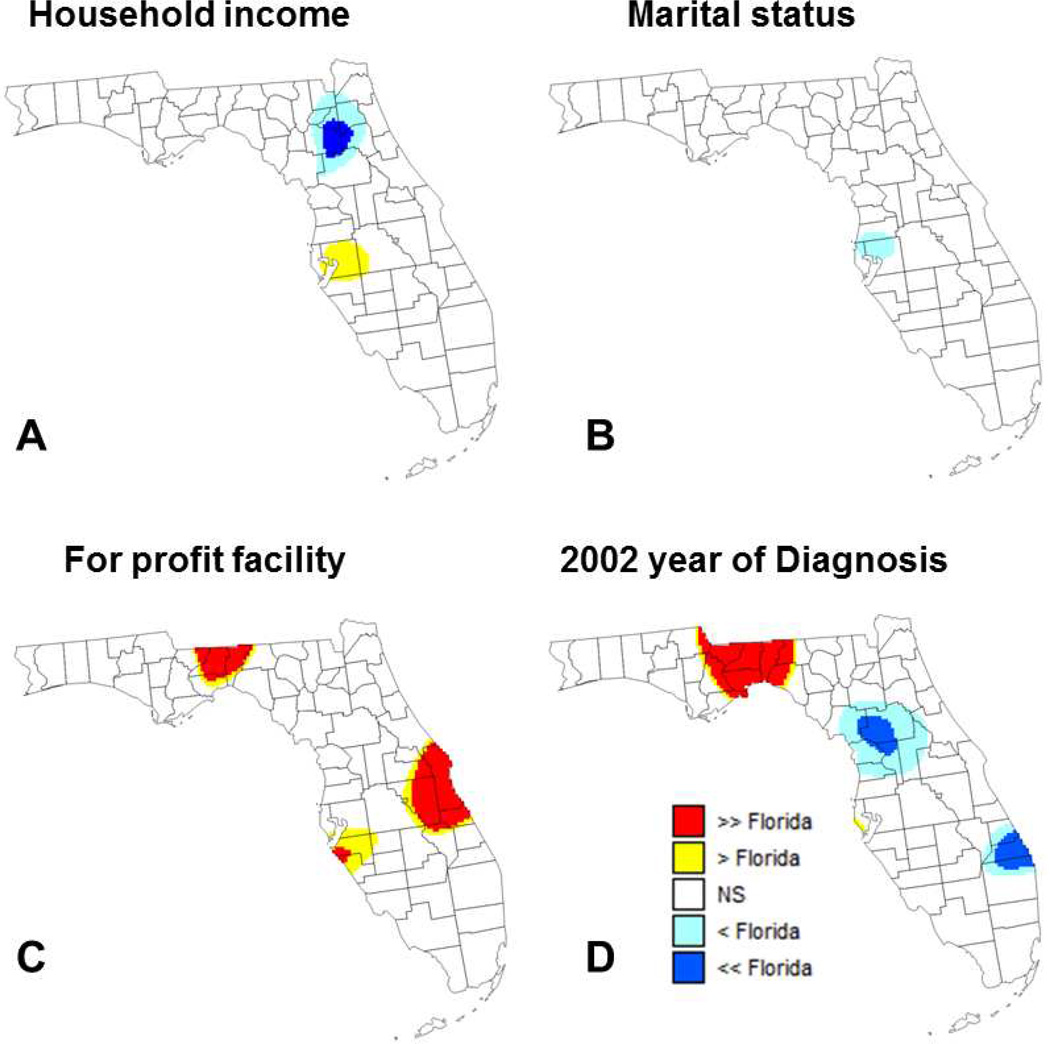
Fig. 7.
Maps of locations where the local odds ratio for different putative factors was significantly lower or higher than the state-level ratio estimated using aspatial regression (NS=non-significant): (A) median income, (B) percentage of married males, (C) percentage of cases diagnosed at for-profit facilities, and (D) percentage of patients diagnosed in 2002 (reference year = 2007).

