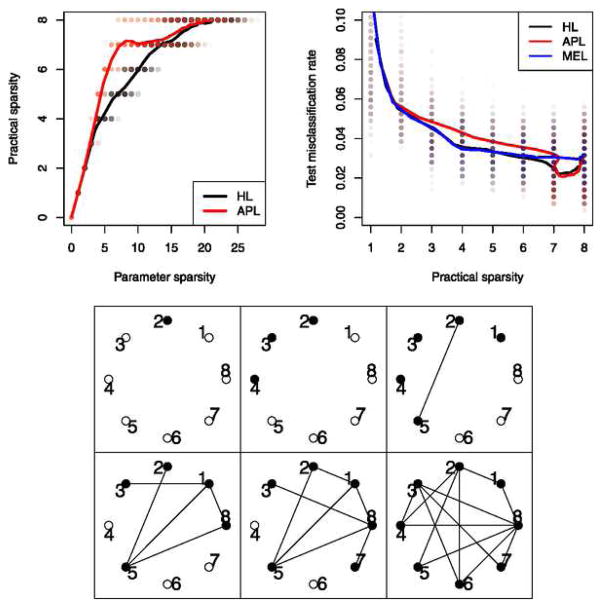
Fig. 1.
Olive oil data: (Top left) Parameter sparsity is the number of nonzero coefficients while practical sparsity is the number of measured variables in the model. Results from all 100 random train-test splits are shown as points; lines show the average performance over all 100 runs. (Top right) Misclassification error on test set versus practical sparsity. (Bottom) Wheel plots showing the sparsity pattern at 6 values of λ for the strong hierarchical lasso. Filled nodes correspond to nonzero main effects, and edges correspond to nonzero interactions.

