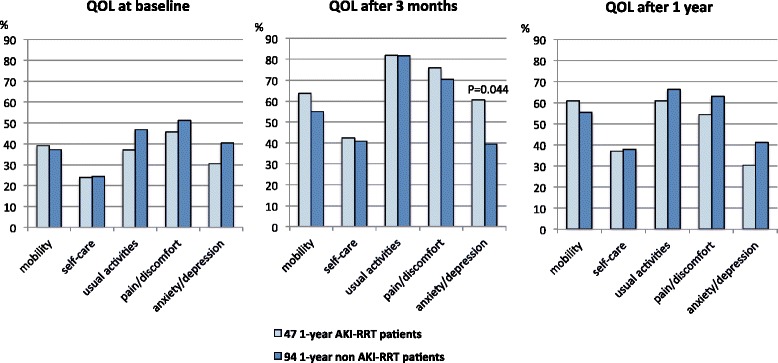
Fig. 2.

EQ-5D assessments in the 1-year cohort. Percentages of patients with some or severe problems per dimension at the three different time points. The X-axis represents the different dimensions of the EQ-5D. The Y-axis represents the percentages (%) of patients with some or severe problems in a respective dimension. Only significant P values (Chi-Square test) are shown above the respective dimensions. AKI acute kidney injury, QOL quality of life, RRT renal replacement therapy
