
Fig. 7.
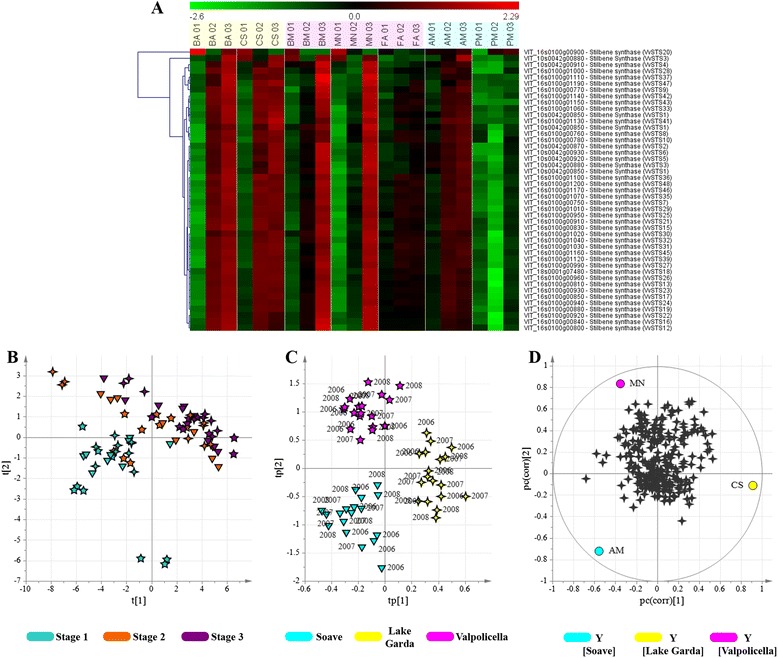
Grapevine berry transcriptome analysis. Heat map of the stilbene synthase gene family (VvSTSs) showing transcriptional profiles (a). The heat map was generated with TMeV v4.8.1 using the average expression level of the three replicates. Data were normalized based on the mean center genes/rows adjustment, and Pearson’s correlation was chosen as the statistical metric. PCA score scatter plot obtained using transcripts related to secondary metabolism (b; explained variance equal to 69 %). Stage 1: beginning of véraison; stage 2: pre-ripening; stage 3: full maturity. oCPLS2-DA score scatter plot (c) and correlation loading plot (d). Samples are separated according to the geographical macrozones, regardless of the vintage. Vineyards: ▼ = AM; ✦ = CS; ★ = MN. In (d) the circles represent the macrozone, while the ✦ symbols represent the transcripts