Figure 5:

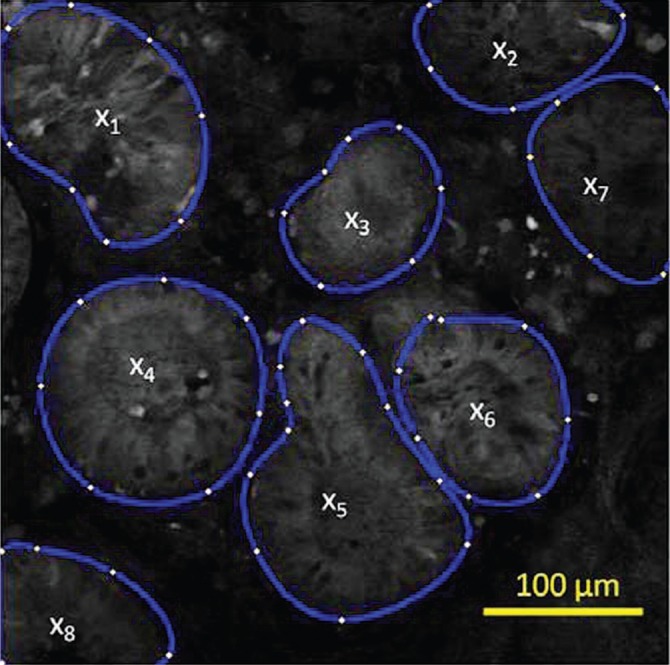
Demonstration of gland selection for mean glandular intensity (MGI) calculation on a confocal image of Barrett’s metaplasia stained with 2-NBDG. MGI is the average of x, where x is the average intensity of each gland.

Demonstration of gland selection for mean glandular intensity (MGI) calculation on a confocal image of Barrett’s metaplasia stained with 2-NBDG. MGI is the average of x, where x is the average intensity of each gland.