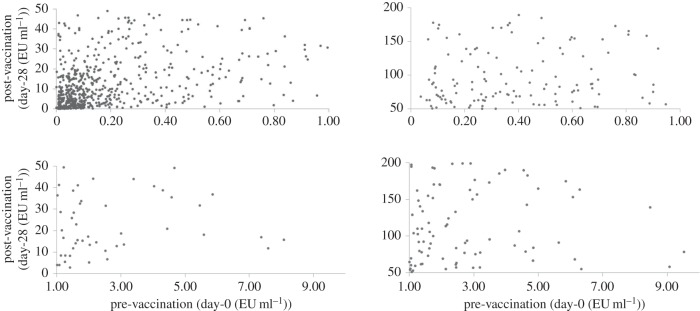
Figure 1.

Scatter diagram depicting variation in pre- and post-vaccination Vi-polysaccharide antibody titres among typhoid vaccine recipients. (The enormity of the extent of variation necessitated splitting the single scatter diagram into four quadrants for display.)
