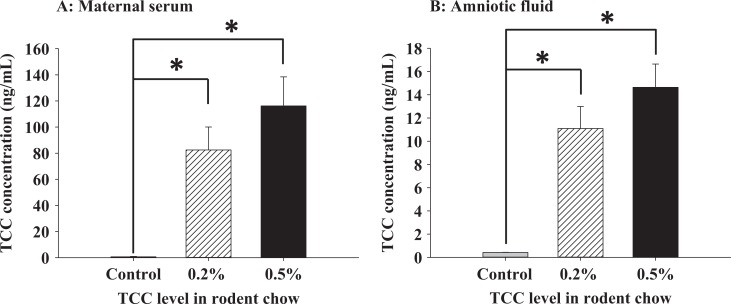
Figure 2.
Experiment I: TCC concentration (ng/mL) on GD 19 from maternal serum (A) and fetal amniotic fluid (B). Pregnant SD rats were treated between GDs 5 and 19 with rat chow supplemented with 0.2% w/w TCC (n = 5, hatched bar), 0.5% w/w TCC (n = 5, dark solid bar), or control food (n = 4, gray solid bar). Data represent mean ± SEM of each group. Data were analyzed with one-way ANOVA followed by Student-Newman-Keuls post hoc test. Statistical significance set at P < .05; * indicates statistical significance between groups; TCC, triclocarban; GD, gestational day; SD, Sprague Dawley; SEM, standard error of the mean; ANOVA, analysis of variance.

